By Peter Budelov
Project Managers (PMs) lead a hectic life because they not only need to manage the day-to-day operations of a project (i.e., work deliverables, schedules, cost, and revenue), but they also must spend time with the appropriate IT tools to do this. Therefore, having accurate, timely, and easy-to-access project reporting data is key to good project management decisions.
Typically when using enterprise project management applications, this data is available but not necessarily easy to get to, may not be readily displayed in a user-friendly manner, does not necessarily have all the data needed, is not configurable, and is undoubtedly unavailable in a disconnected mode.
Project Partners User Interface Applications™ utilize Microsoft® Excel spreadsheets as the interface with Oracle E-Business Suite applications, showing just what Project Managers want to see, the way they prefer to see it. In addition, project Partners Reporting™ leverages the technology of our User Interface Applications (UI-Apps) to provide Project Status Reporting for Project Managers.
In Project Partners’ Reporting, a proprietary summarization process makes key project reporting data available to Project Managers with added dimensions of configurability. The result is not only reporting dry factual data, e.g., cost, revenue, margin, or margin percent. Additionally, the UI-Apps workbook has built-in logic to display configurable indicators that dynamically present different indicators based upon thresholds for each reported metric in every worksheet. Furthermore, these indicators can be color-coded (e.g., red, yellow, or green) to indicate if a metric is in trouble, at risk, or OK based on the defined threshold.
To use the UI-Apps Reporting Workbook, users first search for projects (using various selection criteria) and select the projects they want to review; up to 20 projects may be selected at one time – summarized reporting data for all will be downloaded into the workbook. At this point, the user may work offline if desired – something essential to PMs for whom travel is part of the job. Next, the projects will be displayed in a list, and based upon a few high-level project-health indicators shown for each; the user may drill down to the specifics for a single project.
The Project Metrics Worksheet displays the project’s status (Earned Value, Cost, Revenue, and Schedule overview).

Project Metrics: Project Cost Graph

Project Metrics: Revenue Margin Graph
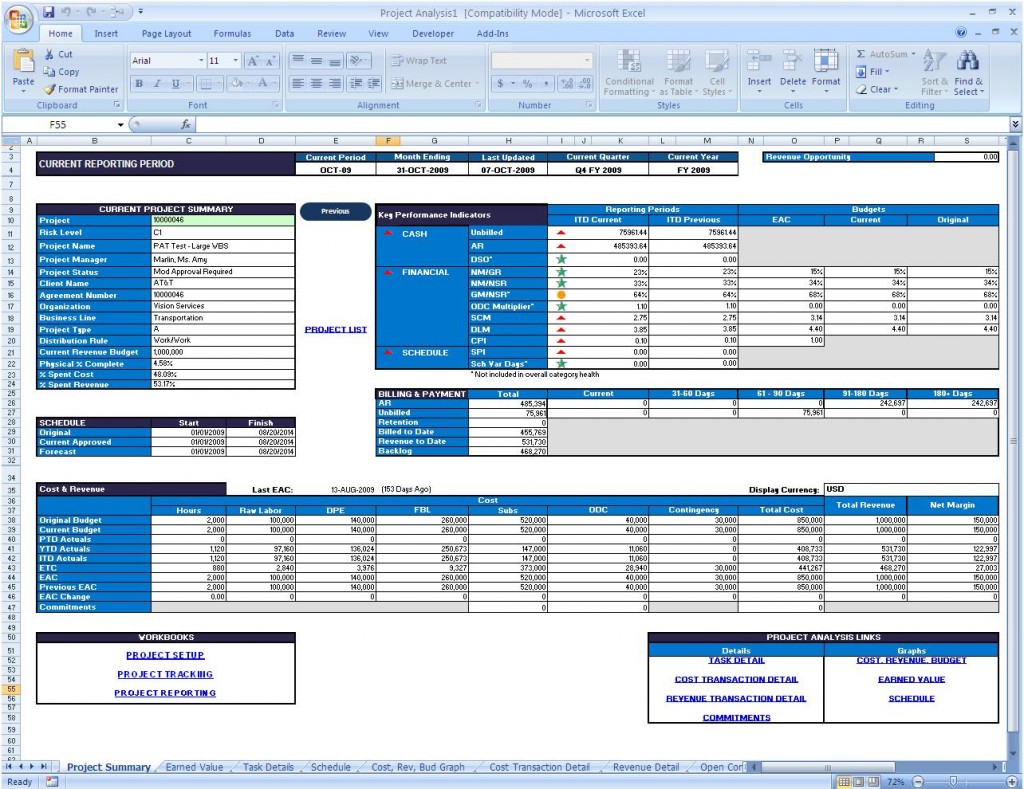
A hyperlink takes the user to the following worksheet in the workbook, Project Summary, which displays overall project setup values and dates, key performance indicators with metrics and KPI indicators, plus aged bill and payment amounts and a summary of cost and revenue by period broken down by type of cost, revenue, and margin.

Project Summary Worksheet
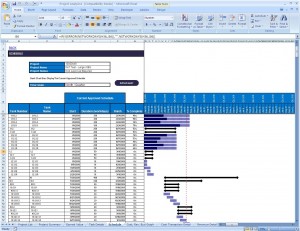
The Project Schedule worksheet displays each task of the WBS with task date information and an optionally displayed Gantt chart showing task start/end date, duration, and percent complete.

Project Schedule Worksheet
The Task Details Sheet has a sophisticated real-time configurable display to show desired details by the task of budget, forecast, actual (cost and revenue, committed and earned value amounts broken down by cost type, and period incurred as appropriate.
These metrics allow project managers to easily and quickly see (a) the overall health of their projects, (b) the WBS and schedule details, (c) the financial and schedule metrics by task, and finally, drill down to the transaction detail to research cost, revenue and committed amounts.
The Net/Net
For Project Managers who want to use the familiarity of Microsoft® Excel to manage their projects, UI-Apps gives them just what they need and nothing more. For Project Managers who need to be able to work in a disconnected fashion while on the road, UI-Apps also enable them to be more productive by utilizing downtime that previously was relegated to travel.